Laravel Websockets
Debug Dashboard
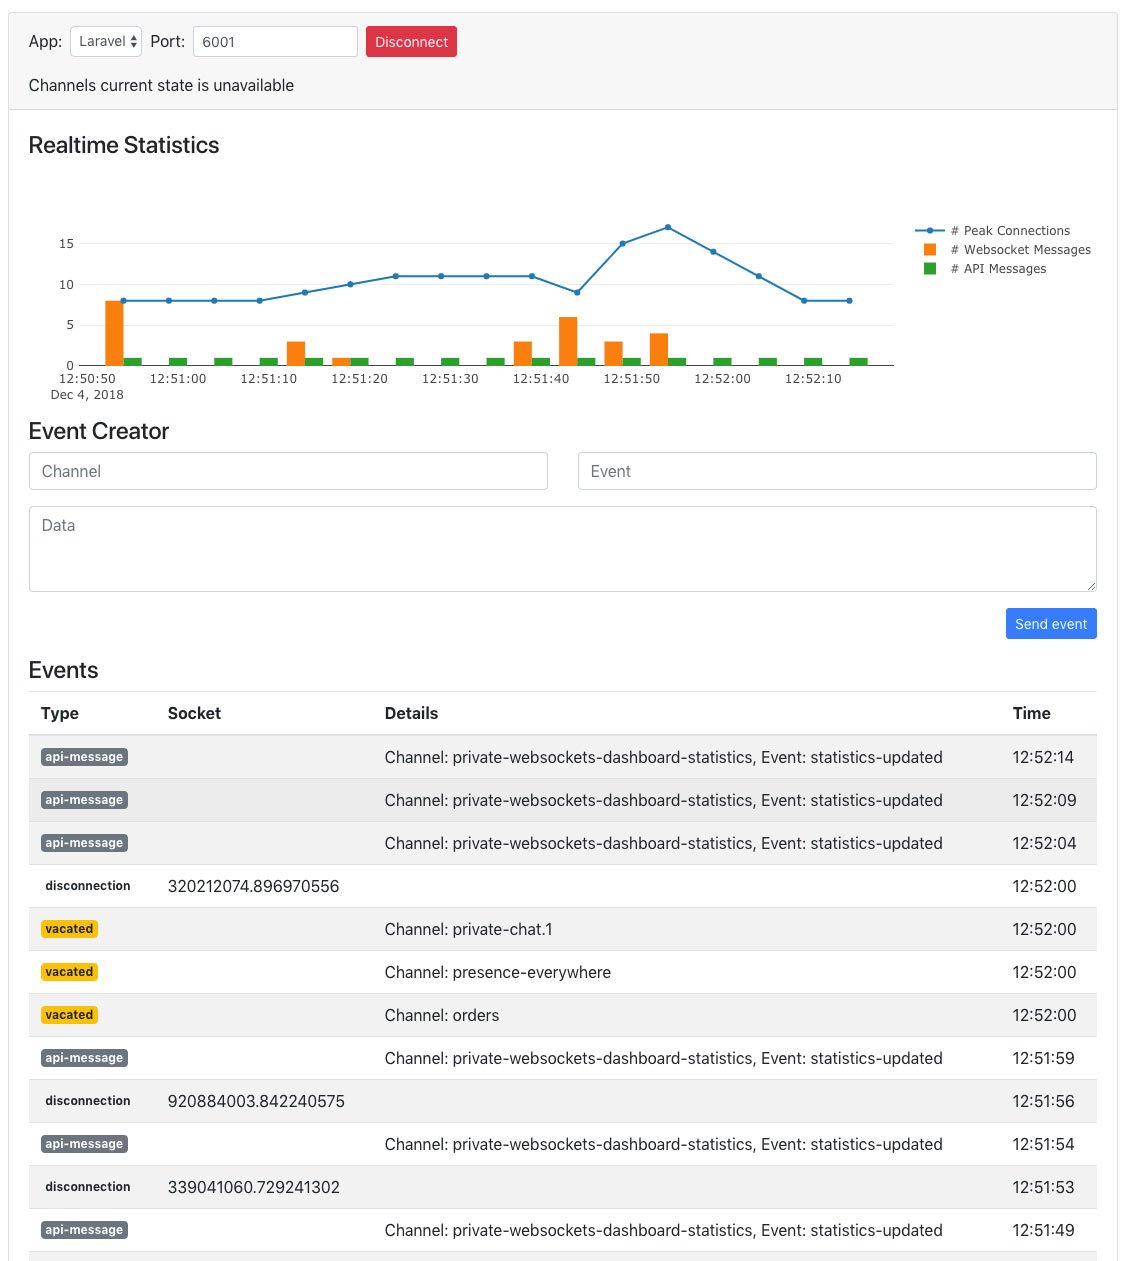
In addition to logging the events to the console, you can also use a real-time dashboard that shows you all incoming connections, events and disconnects the moment they happen on your WebSocket server.
Accessing the Dashboard#
The default location of the WebSocket dashboard is at /laravel-websockets. The routes get automatically registered.
If you want to change the URL of the dashboard, you can configure it with the path setting in your config/websockets.php file.
To access the debug dashboard, you can visit the dashboard URL of your Laravel project in the browser. Since your WebSocket server has support for multiple apps, you can select which app you want to connect to and inspect.
By pressing the "Connect" button, you can establish the WebSocket connection and see all events taking place on your WebSocket server from there on in real-time.
Note: Be sure to set the APP_URL env variable to match the current URL where your project is running to be sure the stats graph works properly.
Protecting the Dashboard#
By default, access to the WebSocket dashboard is only allowed while your application environment is set to local.
However, you can change this behavior by overriding the Laravel Gate being used. A good place for this is the AuthServiceProvider that ships with Laravel.
public function boot()
{
    $this->registerPolicies();

    Gate::define('viewWebSocketsDashboard', function ($user = null) {
        return in_array($user->email, [
            //
        ]);
    });
}
Statistics#
This package allows you to record key metrics of your WebSocket server. The WebSocket server will store a snapshot of the current number of peak connections, the amount of received WebSocket messages and the amount of received API messages defined in a fixed interval. The default setting is to store a snapshot every 60 seconds.
In addition to simply storing the statistic information in your database, you can also see the statistics as they happen in real-time on the debug dashboard.
You can modify this interval by changing the interval_in_seconds setting in your config file.
Cleanup old Statistics#
After using the WebSocket server for a while you will have recorded a lot of statistical data that you might no longer need. This package provides an artisan command websockets:clean to clean these statistic log entries.
Running this command will result in the deletion of all recorded statistics that are older than the number of days specified in the delete_statistics_older_than_days setting of the config file.
You can leverage Laravel's scheduler to run the clean up command now and then.
//app/Console/Kernel.php

protected function schedule(Schedule $schedule)
{
   $schedule->command('websockets:clean')->daily();
}
Event Creator#
The dashboard also comes with an easy-to-use event creator, that lets you manually send events to your channels.
Simply enter the channel, the event name and provide a valid JSON payload to send it to all connected clients in the given channel.
Learn everything about Laravel Websockets
Kickstart your Laravel Websockets project with this in-depth video course – sign up to our newsletter and get a notification when it launches.